THE COMPLETE EXPERIMENT
WHY THIS MATTERS
BEHAVIOR → MOLECULAR PROCESSES → RESPONSE
Write a model command. Inspect every lowering step.
Watch the resulting pathway dynamics unfold.
BIOCOMPILER / ANIMATED IN BLENDER
protocol single · variant baseLoading Blender sequence…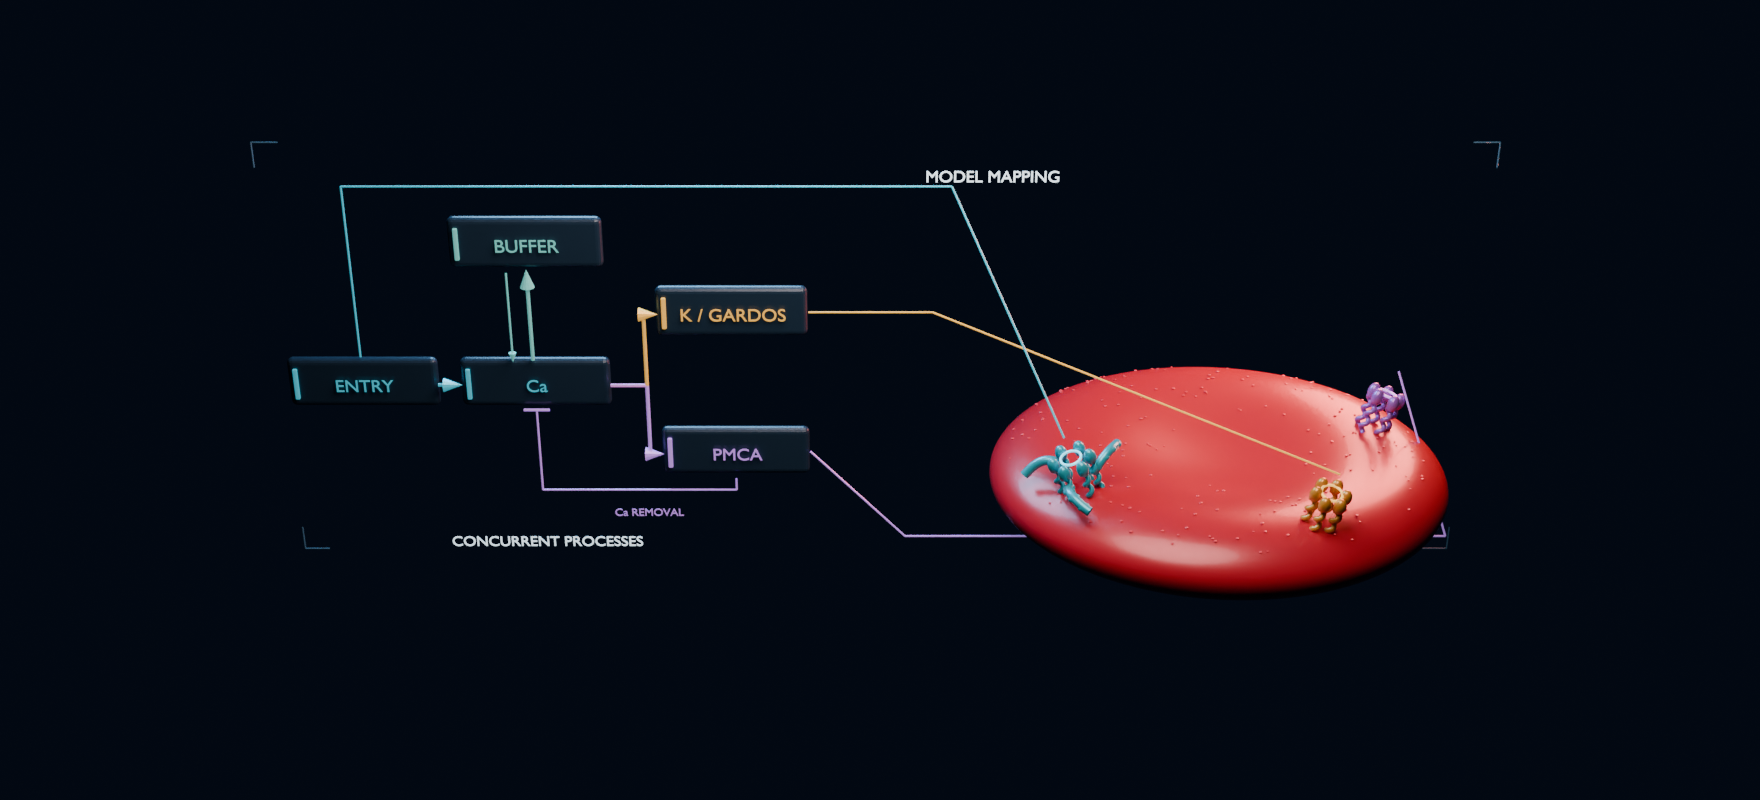
THE COMPLETE EXPERIMENT
All enabled processes run concurrently. Gate poses and particles are schematic; Gardos motion uses a fourth-root scale for visibility. Only particle phase is interpolated; numerical readouts retain saved model values.
A command specifies a protocol and the response to observe.
The links show how representations map to model components. No source-code particles or physical cell construction are implied.
Blender animates the lowering representations and mapping links. The response chapter replays the selected numerical run; transport particles are schematic.
THE LIVE EXPERIMENT
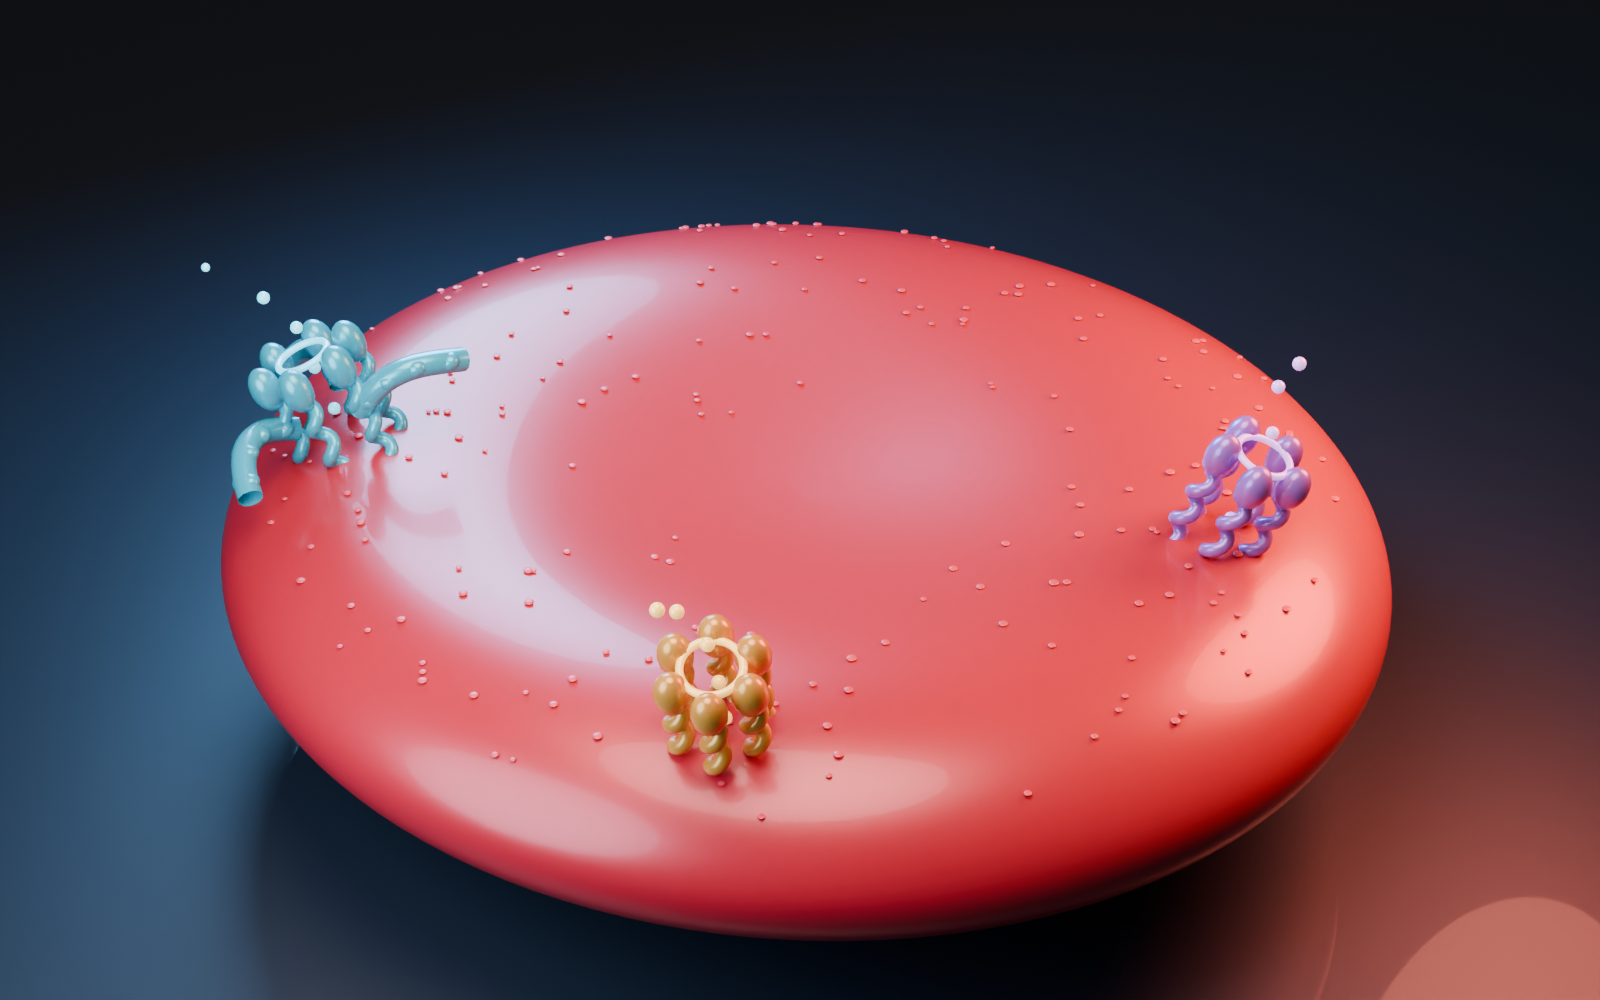
Explore the membrane machinery.
Blender-authored 3D · drag to orbit · scroll to zoom
Enlarged schematic proteins and ion paths; fixed cell geometry.
03 / OBSERVE THE RESPONSE
A prescribed permeability pulse admits calcium. Buffering and PMCA shape its trajectory.
Calcium can recover while potassium remains lost. Recovery of one signal is not a whole-cell reset.
Lines connect sampled model values. Animation intensity follows the trace; individual particles are explanatory. Loc = litre of initial reference cells. The no-pulse reference retains basal drift.
BUILT FROM PUBLIC KNOWLEDGE
We can develop, inspect and test this entire workflow without a wet lab. Public equations supply a starting model; independent observations can later test where it predicts real cells.
Download the RBC 3D asset ↗A fixed-clamp reduction of published red-cell model equations: prescribed calcium entry, rapid calcium buffering, calcium-dependent Gardos conductance, and PMCA extrusion. The model integrates shared calcium and potassium state over 60 seconds. This browser solver is a separate demonstrator, not the qualified B4.2 backend.
It selects a timed calcium-permeability schedule and one of the admitted diagnostic equation variants. These are model inputs. No demonstrated mechanism for delivering a software command to a physical erythrocyte is claimed. Removing a model term is a diagnostic calculation, not a validated biological intervention.
The cell, channel assemblies and transport paths are authored in Blender. Proteins are enlarged schematic forms, not experimentally determined atomic structures. The animation replays Blender transport clips using model-derived activity. Spatial layout, particle counts and travel times are illustrative; cell deformation, ATP depletion and water movement are not calculated.
Next: reproduce published benchmarks, curate species- and protocol-matched observations, define measurement mappings, reserve held-out comparisons, and add sensitivity/uncertainty ensembles. Fluorescence measurements need an observation model before comparison with calcium concentration. A dynamic volume or voltage model would be a separately versioned extension.